


More Inspiration

We offer assistance in connecting and analyzing your data using modern tools. Visualize crucial KPI's from various sources conveniently consolidated into a single, user-friendly dashboard. Leverage these reports to acquire insights for informed decision-making, observe emerging patterns, desired objectives, and even foster motivation to propel you closer to your aspirations.

Analytics
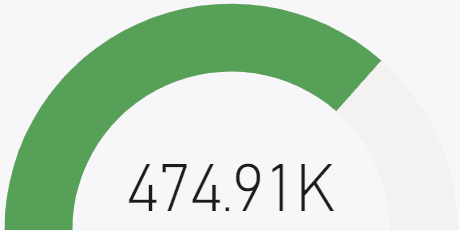
Insights
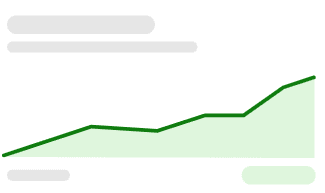
Reports
Explore Automation Plans or Custom Reports
Basic Automation
Automate basic repetitive tasks
$600/m
or $6500 per year
72h Response time
1-2 Basic automation
builds / month
Automation run cycle: 1h
No-Code automations
Trello management board
Pro Automation
Custom, based on needs and requirements, for larger projects
Custom
Priority Support
Guaranteed uptime monitoring
Workflow optimization consultation
Automation refresh: 10 min
Scalable Solutions
Multi-Team onboarding assistance
Custom Report Dashboard
Multi-report dashboard
$1000+
Depends on complexity (<$2500)
Free consult
1 dashboard project
Responsive dashboard
Animated Charts
Dashboard training
Hosting available
FAQ
What is workflow automation and how can it benifit me and my business?
How much can automation save me and my business?
What types of tasks can be automated?
How can I get started with workflow automation for my business?
Can existing manual processes be integrated into automated workflows? And what about changes later on.
What is the typical timeframe for implementing a workflow automation solution?
I'm a small business. Is data analytics really necessary for me?
What is data analytics and why is it important?
What is Power BI and how can it help my business?
How much do these dashboards and reports cost?
I'm not very tech-savvy. Will I be able to understand the reports and dashboards?
How do you ensure my data is secure?
What kind of support do you offer?
Do you offer referral discounts?